Calculating Cash-on-Cash Return for Indianapolis, Indiana Rentals
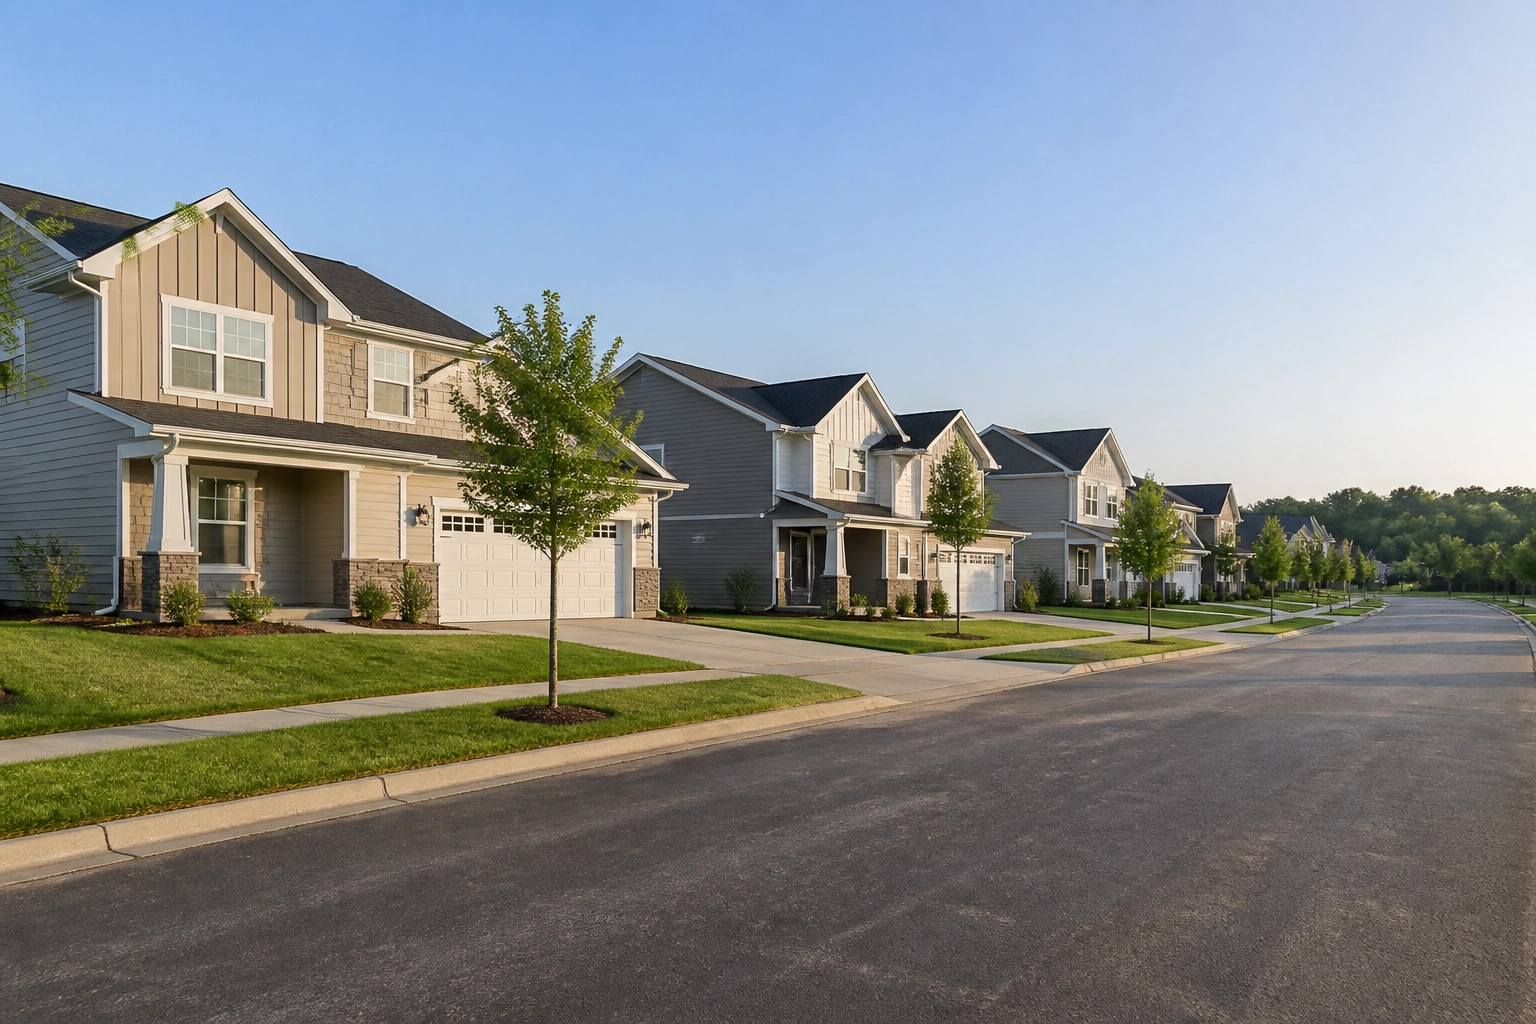
For the modern real estate investor, the metric that truly matters isn't just the purchase price or the gross rent, it’s the velocity and efficiency of your capital. In a market like Indianapolis, where the landscape is shifting from rapid appreciation to a more stable, "yield-first" environment, understanding the math behind your deals is the difference between building a legacy and just owning a hobby.
If you are looking at an investment in Central Indiana, you’ve likely heard about "CAP rates." While CAP rates are great for evaluating the property itself, they fail to account for the most powerful tool in your belt: leverage. This is where the Cash-on-Cash (CoC) Return comes in. It is the pragmatic, no-nonsense metric that tells you exactly how much your cash is working for you.
The Core Formula: Real Estate Math 101
Before you drive down to Fountain Square or Fishers to look at a property, you must be able to run these numbers on a napkin. The formula for Cash-on-Cash return is straightforward, but the devil is in the details.
The Formula:
Annual Pre-Tax Cash Flow / Total Cash Invested = Cash-on-Cash Return
To get this right, you have to be honest about both sides of the equation.
1. Annual Pre-Tax Cash Flow
This isn't just your rent minus your mortgage. You must subtract every single operating expense:
- Gross Scheduled Rent: (The total potential income).
- Vacancy Factor: (Typically 5–8% in Indianapolis for 2026).
- Operating Expenses: (Taxes, insurance, maintenance, property management, and utilities).
- Debt Service: (Your principal and interest payment).
2. Total Cash Invested
This is every dollar you pulled out of your pocket to make the deal happen:
- Down Payment: (The biggest chunk).
- Closing Costs: (Usually 2–5% of the loan amount).
- Initial Repairs/Rehab: (What it costs to make the property rent-ready).
- Holding Costs: (Insurance and taxes paid during the rehab phase).
Moreover, if you are using specialized financing like Bank Statement Loans, your closing costs might differ from a traditional conventional loan. Therefore, knowing your financing strategy upfront is essential for an accurate CoC calculation.

Why Indianapolis Real Estate Math Matters in 2026
As of early 2026, the Indianapolis market has seen a 22.2% increase in active listings compared to the previous year. For investors, this means the "panic-buying" era is over. Sellers are more willing to negotiate, and inventory is sitting on the market for an average of 55 to 77 days.
In this environment, you aren't just betting on the house becoming worth more next month. You are betting on the property’s ability to generate immediate yield. As a result, the Cash-on-Cash return has become the primary filter for savvy investors.
Comparing Two Indianapolis Properties: A Binary Contrast
Let’s look at two common scenarios in the Indy metro area to see how different strategies impact your return.
Property A: The "Yield Play" in Pike Township
- Purchase Price: $225,000
- Down Payment (20%): $45,000
- Rehab/Closing Costs: $15,000
- Total Cash Invested: $60,000
- Monthly Rent: $1,900
- Monthly Expenses (including Debt Service): $1,400
- Monthly Cash Flow: $500
- Annual Cash Flow: $6,000
CoC Return: $6,000 / $60,000 = 10%
Property B: The "Appreciation Play" in Fishers
- Purchase Price: $415,000
- Down Payment (20%): $83,000
- Rehab/Closing Costs: $12,000
- Total Cash Invested: $95,000
- Monthly Rent: $2,800
- Monthly Expenses (including Debt Service): $2,500
- Monthly Cash Flow: $300
- Annual Cash Flow: $3,600
CoC Return: $3,600 / $95,000 = 3.7%
The Reality: While the Fishers property is in a "premium" neighborhood, the Pike Township property is working nearly three times harder for every dollar you invested. If your goal is to replace your W-2 income, Property A is the clear winner. If your goal is long-term wealth preservation and lower maintenance, Property B might be your choice. However, from a pure cash-on-cash perspective, "Yield Plays" dominate the strategy for scaling portfolios.
Case Study: The Irvington Value-Add
Let's look at a real-world scenario from a client who recently targeted the Irvington area, a neighborhood known for its historic charm and strong rental demand from Gen Z and Millennials.
The Deal: Our investor found a distressed duplex for $180,000. It needed $40,000 in work to reach its full rental potential.
The Strategy: Instead of a traditional mortgage, they utilized a DSCR (Debt Service Coverage Ratio) loan. Because the property was a duplex, the lender qualified the loan based on the future rental income of both units, rather than the investor's personal income.
The Math:
- Total Cash Out of Pocket: $45,000 (Down payment) + $40,000 (Rehab) + $8,000 (Closing) = $93,000.
- Post-Rehab Monthly Rent: $1,350 per unit = $2,700 total.
- Monthly Expenses (Taxes, Ins, Management, Vacancy, Maintenance): $850.
- Monthly Debt Service: $1,150.
- Monthly Net Cash Flow: $700.
- Annual Cash Flow: $8,400.
Final CoC Return: $8,400 / $93,000 = 9.03%.
By focusing on a value-add strategy in a revitalizing neighborhood like Irvington, the investor secured a nearly double-digit return while also creating immediate equity through the renovation. This is "thinking like an owner", not just a buyer.
Commission Mindset vs. Residual Reality
Many investors get caught in a "Commission Mindset," focusing on how much they "made" on paper when the property value went up. But paper wealth doesn't pay the mortgage or fund your next acquisition. The "Residual Reality" is that your cash-on-cash return is the only metric that fuels your growth.
If your CoC return is 10%, you have a 10-year path to recouping all your initial capital while still owning the asset. If your CoC is 2%, you’re looking at a 50-year horizon. Thus, the math you do today dictates your lifestyle a decade from now.
Strategic Structuring: How Financing Changes the Game
Your loan choice is the largest lever you can pull to change your CoC return.
- Lower Down Payments: Using programs with 15% or 20% down instead of 25% reduces your "Total Cash Invested," which can skyrocket your CoC return, even if the interest rate is slightly higher.
- Interest-Only Options: Some investor-focused programs offer interest-only periods. This lowers your "Debt Service," increasing your "Annual Cash Flow" significantly in the short term.
- Leveraging Equity: For those finding a mortgage lender for out-of-state investing, utilizing a cash-out refinance on an existing property to fund a new Indiana down payment can effectively make your "Cash Invested" zero (or close to it) in the new deal, resulting in an infinite CoC return.

FAQ: Indianapolis Real Estate Math
What is a "good" Cash-on-Cash return in Indianapolis? In the 2026 market, most professional investors aim for 8% to 12%. Anything above 15% usually involves significant rehab or higher-risk neighborhoods.
Does CoC return include the principal paydown? No. CoC is purely about the cash entering your bank account. Principal paydown is a part of your Total ROI (Return on Investment), but it’s not "spendable" cash today.
How do interest rates impact my CoC calculation? As a general rule, a 1% increase in interest rates can drop your CoC return by 1.5% to 2%, depending on your leverage. This is why shopping for the right structure, not just the lowest rate, is vital.
The Bottom Line
Indianapolis remains one of the premier markets for cash-flow-focused investors, but the "low-hanging fruit" is gone. Success in 2026 requires a clinical approach to the numbers. If you aren't calculating your cash-on-cash return before you sign a purchase agreement, you aren't investing: you're gambling.
Think like an owner. Build like a strategist.
Ready to Run the Numbers on Your Next Deal?
Whether you’re looking for a DSCR loan for an Irvington duplex or a Bank Statement loan for a Fishers suburban home, I specialize in the "non-box" deals that other lenders miss. Let’s look at your scenario and find the structure that maximizes your cash-on-cash return.
Contact: Ebonie Beaco, Mortgage Strategist (NMLS #2389954) Phone: 312-392-0664 Website: www.HomeLoansNetwork.com Powered by Loan Factory, Inc. (NMLS #320841)
Disclaimer: This content is for educational purposes only and does not constitute a loan approval or commitment. Loan programs, terms, and eligibility requirements are subject to change and vary by borrower and property. Contact 312-392-0664 for specific scenarios.