Why Everyone Is Talking About Today’s Housing Inventory Update (And You Should Too)

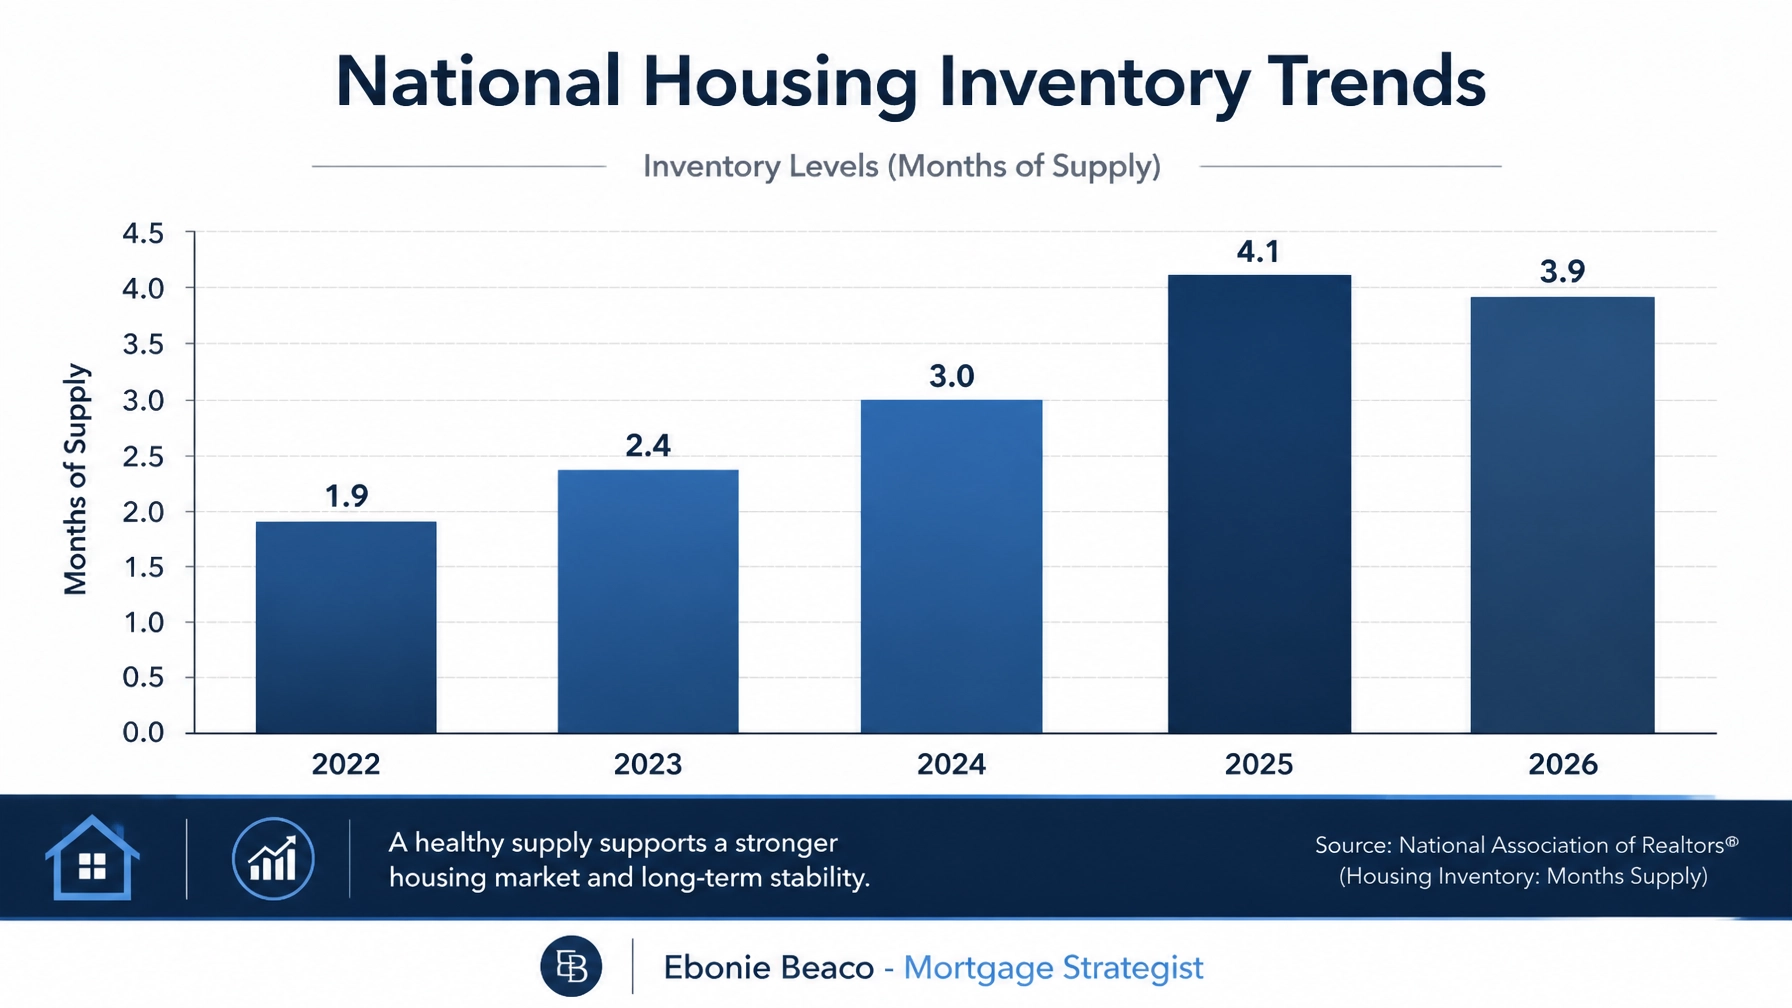
The housing market has reached a pivotal juncture as of early June 2026. For the first time in four years, national housing inventory is beginning to contract on a year-over-year basis. This shift represents a significant move away from the steady supply gains seen throughout 2024 and 2025.
Current data indicates that active listings are approximately 1% lower than they were at this time last year. While the market is no longer in the extreme supply drought of the early 2020s, it remains structurally undersupplied. Total inventory levels still sit roughly 15% below the benchmarks recorded in 2017.
Homeowners, real estate investors, and prospective buyers are closely watching these figures. A tightening supply often leads to renewed upward pressure on property values. Understanding these dynamics allows you to position your real estate portfolio or home purchase strategy more effectively.
Explore the nuances of today's market to determine how these supply shifts impact your long-term wealth. You can find detailed updates on shifting market conditions and available financing at the Home Loans Network blog.
The National Inventory Inflection Point
The U.S. housing market recorded approximately 1,058,700 active listings in May 2026. According to the latest housing inventory report, this inventory dip signals a potential re-acceleration of price growth in certain regions. Although national price growth remains modest at roughly 0.3% year-over-year, the scarcity of available homes limits buyer leverage.
Mortgage rates have stabilized between 6.4% and 6.6% for 30-year fixed loans. This stability has encouraged a slow but steady stream of demand from buyers who have adjusted to the current interest rate environment. However, the lack of new listings continues to be the primary hurdle for transaction volume.
The National Association of Realtors (NAR) reports approximately 4.4 months of supply nationwide. A balanced market typically requires 5 to 6 months of inventory to satisfy demand without aggressive price hikes. Because we remain below that threshold, the market is still categorized as a "slow seller's market."
Jump in to the data and compare how these national trends align with your local market. Investors often utilize DSCR rental property loans to acquire assets quickly before prices climb higher in response to falling inventory.
Regional Divergence: Where the Supply is Moving
The national average often masks the reality of local real estate markets. In Illinois, specifically the Chicago metropolitan area, inventory levels are described as reaching critical shortage levels. This creates a highly competitive environment for both homeowners and buy-and-hold investors.
Conversely, markets like Seattle and parts of California have seen inventory gains of nearly 30% over the previous year. In Florida and Georgia, the market remains split between high-demand coastal areas and more balanced inland regions. Virginia and Michigan continue to show resilience with low days on market and stable pricing.
Investors in Alabama, Arkansas, Kentucky, and Missouri are finding unique opportunities in secondary markets. These regions often offer more attractive entry prices and better inventory availability than major coastal hubs. Access the right financing solutions for these varied markets by visiting our home purchase guide.
Accessing Equity in a Tight Market
Rising property values, fueled by low inventory, have significantly increased the amount of tappable equity available to homeowners. Many individuals are now using a HELOC or a cash-out refinance to fund home improvements, consolidate debt, or purchase investment properties.
HELOC (Home Equity Line of Credit): A revolving line of credit that allows you to borrow against the equity in your home as needed. This is an effective tool for homeowners who want to maintain their low primary mortgage rate while accessing funds for other ventures.
Cash-Out Refinance: Replacing your existing mortgage with a new, larger loan and receiving the difference in cash. This strategy is often preferred when the new mortgage rate is comparable to or lower than the current rate, or when a large lump sum is required for a major project.
Financial Example: HELOC Equity Extraction
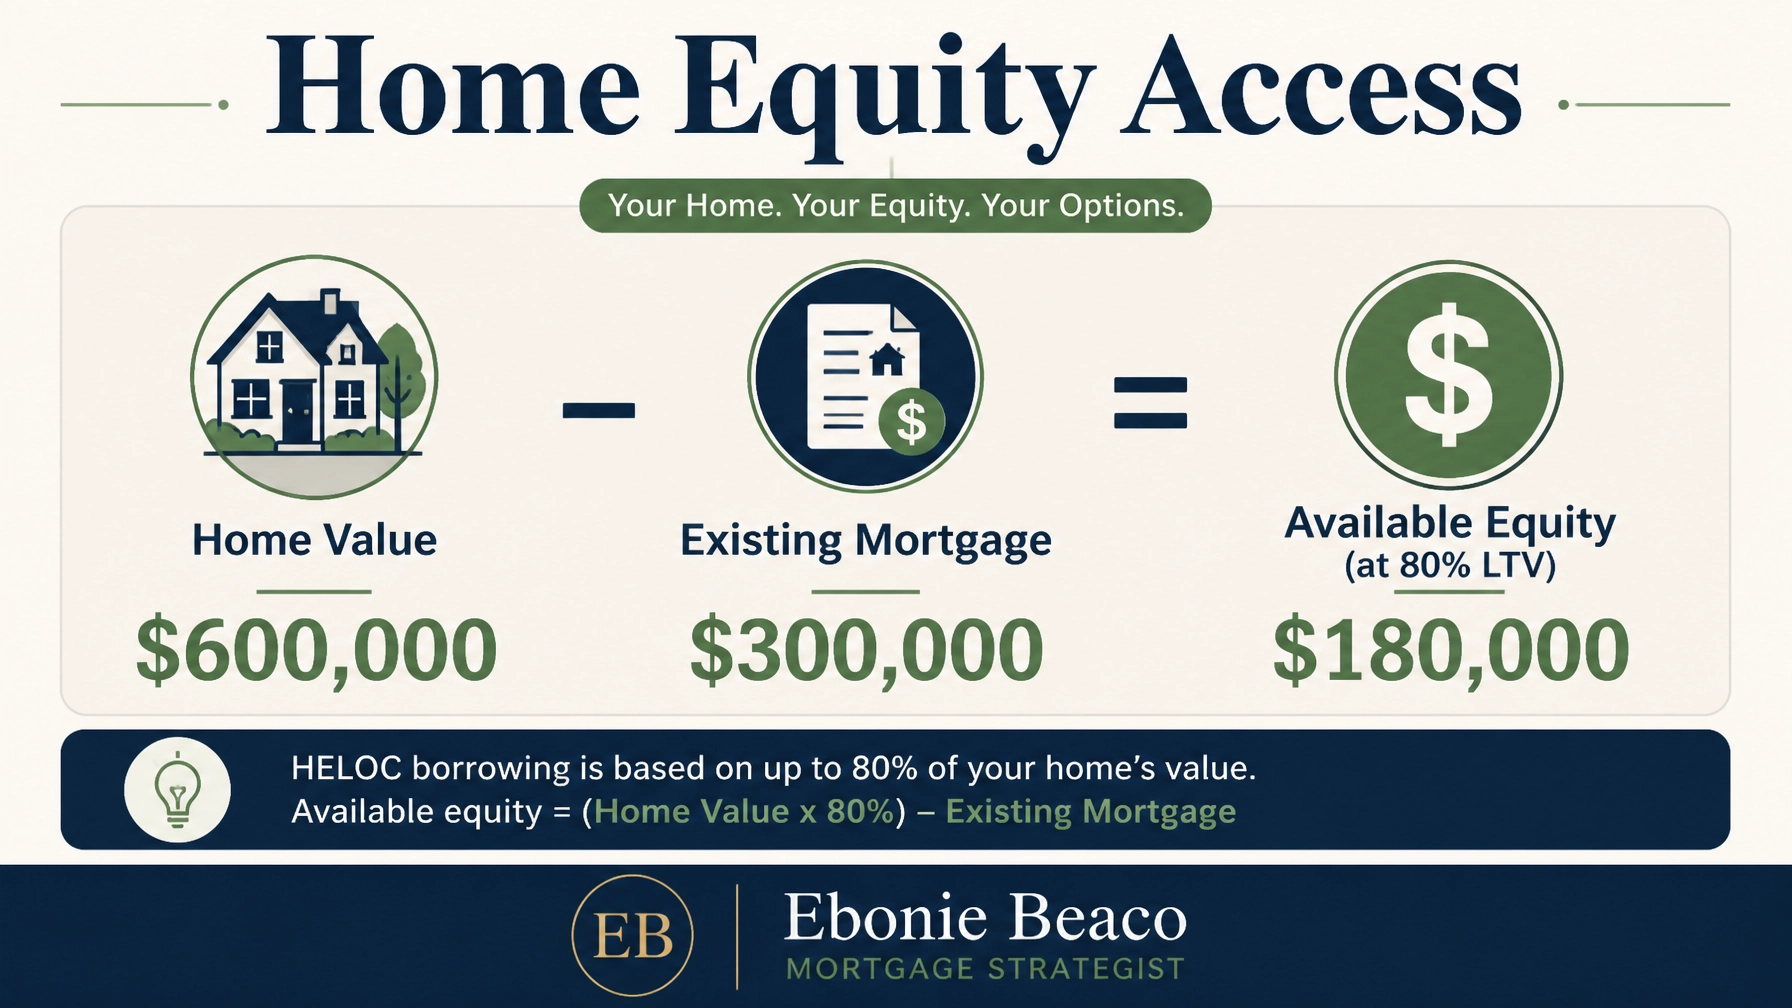
Consider a homeowner in Virginia with a property valued at $600,000 and an existing mortgage balance of $300,000. Many lenders allow for a combined loan-to-value (CLTV) ratio of up to 80%.
- Property Value: $600,000
- Max Loan Amount (80% LTV): $480,000
- Existing Mortgage: $300,000
- Available Equity for HELOC: $180,000
By establishing a $180,000 line of credit, this homeowner can act quickly on investment opportunities or handle unexpected expenses without selling their primary residence. Compare your equity options and see how a home refinance could benefit your financial profile.
Strategic Financing for Real Estate Investors

Real estate investors are navigating the current inventory shortage by utilizing Non-QM mortgage loans. Specifically, DSCR investor loans have become the industry standard for scaling rental portfolios without the need for personal income verification.
DSCR (Debt Service Coverage Ratio): A financial metric used by lenders to evaluate a property's ability to cover its own debt obligations through rental income. This allows investors, including self-employed borrowers and Airbnb operators, to qualify based on the property’s performance.
Fix and Flip Loans: Short-term financing used to purchase and renovate distressed properties. In a low-inventory environment, these loans are vital for investors who create "new" inventory by revitalizing older homes in established neighborhoods.
Financial Example: DSCR Rental Property Analysis
An investor is looking to purchase a multi-unit building in Chicago, Illinois, for $450,000. To qualify for a landlord loan, the lender analyzes the projected rental income against the monthly debt.
- Purchase Price: $450,000
- Monthly Rental Income: $3,200
- Monthly PITIA (Principal, Interest, Taxes, Insurance, Association): $2,400
- DSCR Calculation: $3,200 / $2,400 = 1.33
A DSCR of 1.33 means the property generates 33% more income than the cost of the mortgage. Lenders typically look for a ratio of 1.20 or higher, making this an excellent candidate for financing. Explore our wide range of loan programs to see which investor tools fit your next deal.
Mortgage and Investment Glossary
Understanding technical terminology is essential for navigating modern real estate transactions. Here are brief definitions of key concepts found in today’s inventory updates:
- DTI (Debt-to-Income Ratio): A percentage that represents the portion of your gross monthly income used to pay recurring debts. Lenders use this to determine your ability to manage monthly payments and repay borrowed funds.
- PMI (Private Mortgage Insurance): A type of insurance required for conventional loans when the down payment is less than 20% of the home's value. It protects the lender in the event of a default but adds to your monthly carrying cost.
- Bridge Loan: A short-term loan used to bridge the gap between the purchase of a new property and the sale of an existing one. This tool is frequently used by homeowners in competitive markets to make non-contingent offers.
- Bank Statement Loans: A financing option for self-employed borrowers that uses business or personal bank statements to verify income instead of tax returns. These loans provide flexibility for entrepreneurs with significant business write-offs.
- ITIN Mortgage: A home loan designed for individuals who have an Individual Taxpayer Identification Number rather than a Social Security Number. These programs expand homeownership opportunities to a broader range of residents.
Navigating the Market Moving Forward

As we move further into June 2026, the seasonal peak for home sales is in full swing. According to the NAR existing home sales data, June historically features the highest monthly sales volume of the year. Sellers in shortage markets like Miami and Chicago can expect fast turnover and multiple offers.
Buyers and investors should remain disciplined. While inventory is tightening, the market is not as overheated as the 2021 era. Sellers are more willing to offer concessions, such as rate buydowns or closing cost credits, to attract qualified buyers. These concessions can materially improve your initial cash flow on an investment property.
Whether you are a first-time homebuyer or an experienced portfolio investor, the key to success in a low-supply environment is preparation. Having your financing in place before you find a property is mandatory for competing effectively.
Schedule a 1 on 1 at https://calendly.com/homeloansnetwork
Ebonie Beaco
Mortgage Strategist | Senior Loan Officer
Home Loans Network powered by Loan Factory Inc.
NMLS #2389954
HomeLoansNetwork.com
312-392-0664